Data Visualisation Tool
Transform raw datasets into actionable insights with PlotLista. Edit your datasets with ease and transform complex numbers into beautiful, interactive charts.
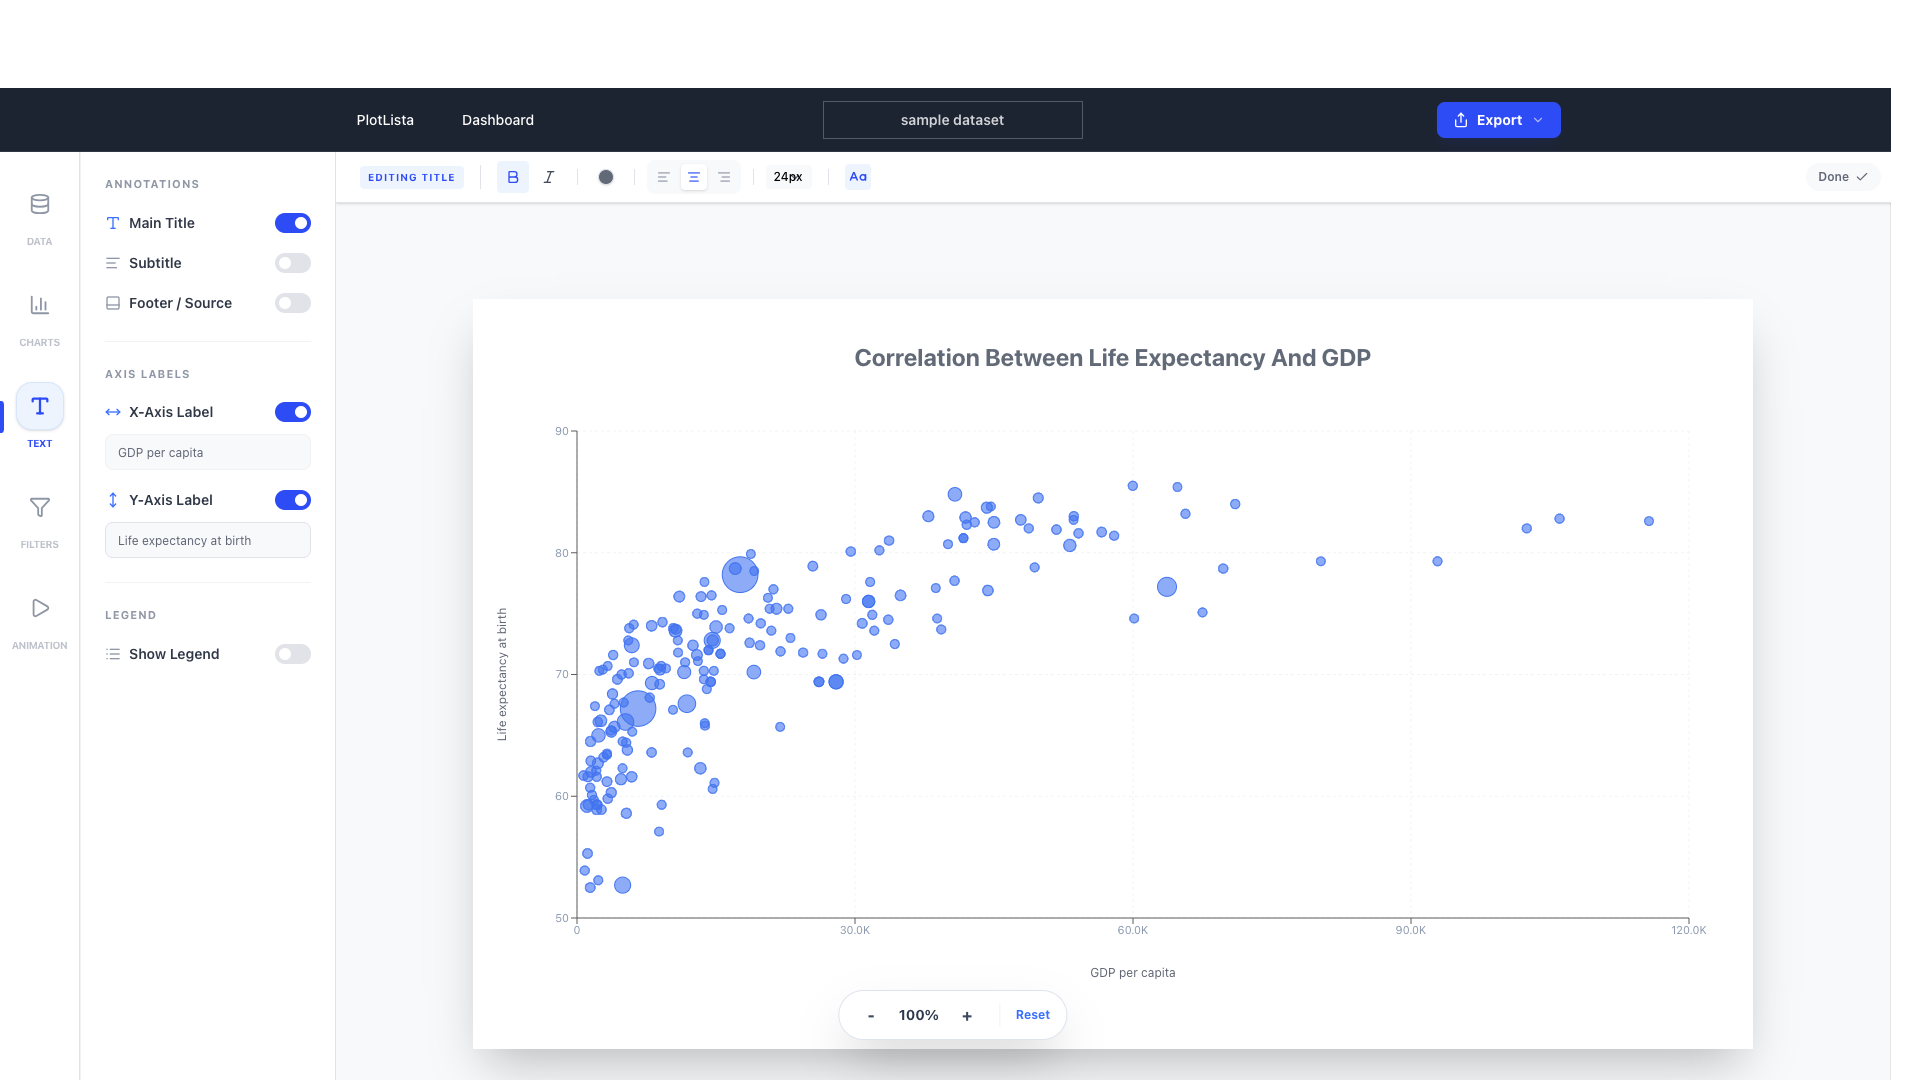
Powerful Insights
Interactive Chart and Video in Seconds
Upload your dataset, customize your visual style, and export studio-quality data charts ready for your next presentation or social post.
- Dynamic Visualization.
- Transform raw CSV and database records with real-time filtering and synchronization.
- Automated Video Export.
- Generate MP4 exports of your animated charts.
- Share & Embed Everywhere.
- Go public with a unique link or embed interactive charts directly into your website
Simple Workflow
From raw data to chart and video
PlotLista streamlines the technical hurdles of data storytelling,
letting you focus on the insights that matter.
- Step 1Upload Dataset
Import your CSV or Excel files. Check and edit your data online
- Step 2Customise Visuals
Choose your chart type, apply filters, and tweak colors. Watch your data come to life in real-time.
- Step 3Export, Share & Embed
Download high-quality assets (PNG, SVG, MP4) or embed your interactive chart anywhere.
Ready to bring your data to life?
Start using PlotLista today.
Join hundreds of analysts and storytellers who transform boring spreadsheets into captivating visual narratives. No credit card required.